Friday, July 22, 2016

Half a Billion Years Ago in (Proto) Staten Island

The next time you are enjoying the spectacular views of Manhattan from the North Beach at Sandy Hook, NJ, shift your gaze across the Verrazano Bridge to Staten Island. The crest of that bland, dark ridgeline is Todt Hill. Todt is Dutch for “dead”.

At 410 feet, it is the highest natural point on the eastern seaboard south of Maine. The Dutch settlers probably called it “Dead Hill” because of its rocky, treeless outcrops. One of the bedrock exposures is serpentinite: grayish-green, about 430 million years old, and consisting mainly of the mineral serpentine. It contains such high levels of magnesium that plants can't grow in its thin soils.

That was then. Today, Todt Hill is a verdant, upscale community, that was once home to Paul Castellano of the Gambino crime family.

An average sample of this serpentinite also contains about 27% chrysotile asbestos. In 1858, the H.W. Johns Manufacturing Company began mining chrysotile asbestos in Staten Island for manufacturing fire-resistant shingles (Powell, 2005). They eventually merged with Johns-Manville, which went on to manufacture a variety of asbestos-containing products in numerous factories, including one in Manville, NJ. It was litigated into bankruptcy in 1982, by “class action lawsuits based on asbestos-related injuries such as asbestosis, lung cancer and malignant mesothelioma.”

The west coast has outcrops of serpentinite as well, but the serpentine in the San Andreas Fault is about 400 million years younger than in Staten Island. The University of California has published a factsheet about how to recognize and reduce risks from the asbestos in its landscape.

That's all well and good but how the hell did it get there?
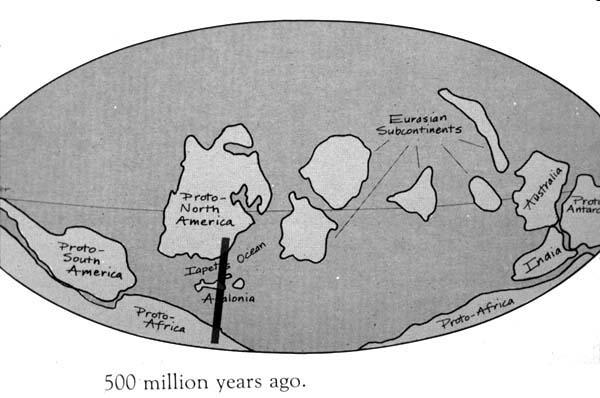
0.5 bya

Half a billion years ago, North America was a continental land mass near the equator called Laurentia. It was across the Iapetus Ocean (an early version of the Atlantic Ocean) from Gondwana - the ancient continent of Africa, South America, Australia, Antarctica, and India (Benimoff and Ohan, 2005), according to the theory of plate tectonics. The plates containing these continents were converging and would eventually form the single supercontinent of Pangaea about 200 million years later.

Converging means colliding. About 470 million years ago, as the Iapetus Ocean was closing during the slow-motion collision of Laurentia and Gondwana, a string of volcanic islands in between the two continents (map) called the Taconic Arc collided with Laurentia (Powell, 2005).

As the ocean floor between Laurentia and the islands was driven under Laurentia (subduction), a “slice”of it buckled onto the continent. This fragment was composed of peridotite, which over time “metamorphosed to form the string of serpentinite pods that occur across the New York City area, including the Staten Island serpentinite” (Powell, 2005).

It's the oldest rock on Staten Island. NJ's serpentine deposits are discussed on page 5 of this 2014 NJGS newsletter.

Cameron's Line

Not only is the Taconic Orogeny the source of this asbestos, as well as the first of three mountain -building events that eventually formed the Appalachian mountains, it created a crack in the earth's crust - a fault - called Cameron's Line.

Cameron’s Line is an 80 to 180 foot wide band of crushed rock originating in New England that lies about 600’ below NY Harbor. It crosses the Bronx, follows the East River, and passes under Staten Island to the west of Todt Hill. This map (pdf-p 2, Figure 1) shows it (CL) entering NJ's Coastal Plain in Middlesex County by western Raritan Bay. This is near the Fall Line - the geologic boundary between the the rocks of the Piedmont and sandy outwash of the Atlantic Coastal Plain – that more or less follows Rt 1 in NJ.

NJ's Coastal Plain is deposited on a bedrock of gneiss and schist in Monmouth County (pdf-p 21) – metamorphic rocks formed from shale and sandstone – and other rock (pdf-p 12). In Monmouth County, this “basement rock” slopes steeply under the deepest aquifer in the County, the Potomac-Raritan-Magothy aquifer system (map). The basement rock is about 500 feet below sea level in Aberdeen, and more than 1500 feet BSL in Manasquan – and over a mile in Cape May (map on pdf-p 19 ).

Cameron's Line cuts through the basement rock beneath the northern Coastal Plain and may eventually join with the Huntingdon Valley Fault zone (HVF on the map in Figure 1) near Philadelphia and Trenton (pdf-p 17).

Earthquakes in NJ are mostly caused by the Ramapo Fault along the Ramapo mountains, as well as Cameron’s Line. The Ramapo Fault is about twice as old as Cameron's Line, and at 1 billion years is one of the oldest faults in the US. This is one of the reasons the earthquakes on the East Coast are less active than on the West Coast - because the geology of the East Coast is so much older. The crust on the East Coast is also cooler and more rigid than on the West Coast, so seismic waves disperse further and earthquakes are not as intense locally.

The New Jersey Department of Environmental Protection's webpage on the Earthquake Risk in New Jersey, states that “the presence or absence of mapped faults (fault lines) does not denote either a seismic hazard or the lack of one ...”

Okay. In any case, what's beneath those rolling hills in Staten Island is anything but bland. Or as Job said: “As for the earth, out of it cometh bread: and under it is turned up as it were fire.”


Selected References (no longer posted)

Benimoff, A. and Ohan, A. Accessed 12/23/05. The Geology of Staten Island. Formerly posted at www.library.csi.cuny.edu/dept/as/geo/sigeo.htm

Powell, Wayne. Accessed 12/23/05. The Staten Island Serpentinite. Formerly posted at http://academic.brooklyn.cuny.edu/geology/powell/NYCgeology/staten%20island/staten_island.htm


Monday, June 6, 2016

A Dead Zone Almost Half As Big As NJ Formed Offshore 40 Years Ago

Climate scientists are studying three major changes to the ocean caused by climate change: warming, acidification, and deoxygenation. Both low oxygen and acidity are expected to worsen as ocean temperatures rise, especially in areas that already have a history of naturally low oxygen levels.


NJ learned that 40 years ago.

1976

June is the 40th anniversary of the first reports by divers off Sandy Hook of a floc-covered seafloor of dead or dying fish and shellfish. By the 4th of July, sulfide-blackened bottom waters had expanded southward about 12 miles off Manasquan (Mahoney, 1979; Walsh, 1979).

By the time the Bicentennial summer had passed, 3300 square miles of bottom waters - 60 feet to 37 miles offshore, from Sandy Hook to Cape May – had become hypoxic (low-oxygen) or anoxic (no oxygen) (Sindermann et al., 1979).


Cooler temperatures and vertical mixing of the water column finally put oxygen back into the bottom waters by October. But the commercial fishing industry has lost more than $430 million in surf clams, bluefish, tuna, fluke, sea bass, and lobster. It was declared a resource disaster area by the Federal government, and is still the worst marine die-off in the state’s recorded history (Sinderman et al., 1979; Walsh, 1979).

Not Pollution

While the die-off happened near the highly-polluted Hudson-Raritan Estuary, as well as the sludge and spoils dumpsites that existed offshore in 1976, there jut wasn't enough nutrients from these sources to account for the scale of the event (Swanson et al., 1979).

Instead, it was the way weather and ocean currents came together that year to create an anomalous, massive event - a "perfect storm”, like Superstorm Sandy, but below the ocean surface.

Since it was much warmer than usual during February and March, the ocean surface began warming earlier than normal. As the lighter, less dense water at the surface warmed faster than at the bottom, the water column stratified and formed a barrier that isolated surface water from bottom water (Chant et al., 2004a). Salinity (halocline), temperature (thermocline),and density (pycnocline) stratifications developed earlier than usual (Sinderman et al., 1979; Swanson et al., 1979). The cooler, denser, and less oxygenated bottom layer separated from the ocean surface – a few months earlier than normal.

This meant the trapped oxygen had to last a few months longer. Secondly, river run off began two months earlier and this led to more nutrients being deposited into the bay. On top of all of this, there was significantly less storm action that spring and summer. Usually the storms break up algae blooms and mix up the water column bringing oxygen to the deeper water layers. All of this meant the oxygen in the ocean depths had to last the marine life two additional months.”

Winds and Currents

Most significantly, southerly winds began in late winter rather than in April, and southwest winds persisted for 4-6 weeks through May and June (Malone et al., 1979; Sinderman et al., 1979; Swanson et al., 1979). Not only did the wind create a stronger thermocline separating the surface and bottom water - it concentrated a massive bloom of the dinoflagellate Ceratium tripos in the isolated bottom waters.

C. tripos is normally an insignificant species of algae found offshore in cold, dark water, where its numbers are kept in check by grazing copepods (Malone et al., 1979; Sinderman et al., 1979; Swanson et al., 1979). But that year the southwesterly winds moved it into the sealed-off bottom waters, where it accumulated from February until July (Malone et al., 1979; Sinderman et al., 1979; Swanson et al., 1979).

The persistent southwesterly winds also slowed, then reversed. the normal southwestward (north to south) flow of bottom currents on the shelf (Sinderman et al.,. 1979; Walsh, 1979), massing the algae in stagnating currents, until the algae bloom finally used up all the available nutrients and oxygen (Malone et al., 1979; Sinderman et al., 1979; Swanson et al., 1979). Then the bloom crashed, using up even more oxygen as it decomposed - initially from Sandy Hook to Manasquan, then expanding towards Atlantic City (Mahoney, 1979). The dead algae was the ubiquitous floc the divers had seen.


As the decomposing bloom rapidly used up all the remaining oxygen, sulfate – the oxygenated form of sulfur in seawater - was reduced to the form without oxygen - hydrogen sulfide. H2S is a gas that smells like rotten eggs and turns water and mud black. It is lethal to marine life, especially benthic (sediment dwelling) organisms – like surf clams, hard shell clams (quahogs), lobsters, and sea scallops. They are literally stuck in the mud – and couldn't flee like most of the finfish did. Some of the territorial fish, such as the eel-like ocean pout, died hiding in the rocks (Reid, 2006; Sinderman et al., 1979; Swanson et al., 1979).

Upwellings

The low oxygen event in 1976 happened in part due to a strong, early upwelling. Winds normally predominate from the south during the summer in NJ and form a nearshore current at the surface that flows to the north. This creates the littoral drift that deposits sand on the southern side of jetties in Monmouth, and is why we have a barrier beach like Sandy Hook. When southwest winds persist for several days, cold, higher-saline bottom water flows towards the shoreline as warmer, lighter water is disperses offshore. Upwellings are why sometimes on a blazing hot day at the beach the water is too cold to go swimming.

There are nice graphics of upwellings at the Rutgers Center for Ocean Observing Leadership (the COOL Room) here and here. In 2015, @Rutgers_Cool tweeted the first upwelling of the year on May 26th. No upwelling tweet so far this year because of our cooler El Nino spring.

Staying Tuned

In 2011, Rutgers tracked chlorophyll levels in an offshore algae bloom of Nannochloris that became huge enough to make the news and be called “the blob”. This was also caused by an upwelling, and stretched from Sandy Hook to Cape May, but was broken up by Hurricane Irene in August before it could grow large enough to lower oxygen levels.

Scientists at the Smithsonian Environmental Research Institute in Maryland have found that Atlantic Silversides (spearing) in Chesapeake Bay will die in oxygen concentrations that don't normally kill them when the water is also acidic. Silversides are the bottom of the marine food web in NJ as well. Anything that threatens their survival also threatens the survival of the larger predator fish that depend on them.

Rutgers' Department of Marine and Coastal Sciences uses marine gliders (Autonomous Underwater Vehicles) to map subsurface dissolved oxygen levels off the NJ coast, that has been supported by both the EPA and the NJDEP, Station JCTN4 (Buoy 126) at the Jacques Cousteau Reserve near Atlantic City measures dissolved oxygen in the Great Bay at the southern end of Barnegat Bay.

You can see which way coastal currents are moving, and lots of other information, whenever you like, at The New York Harbor Observing and Prediction System (NYHOPS) webpage, maintained by the Davidson Laboratory at Stevens Institute of Technology.

Selected References

Chant, R.; Glenn, S.; and Kohut, J. 2004. Flow reversal during upwelling conditions on the New Jersey inner shelf. Journal of Geophysical Research. Vol. 109, C12S03.

Figley, B., Carlson, J., Vaughan, D., and Hollings, S. Accessed 6/5/16. Ocean Fishkill/1976. NJScuba.net http://www.njscuba.net/biology/misc_water.php#FishKill


Malone, T., Esaias, W. and Falkowski, P. 1979. Chapter 9. Plankton dynamics and nutrient cycling. Part 1. Water column processes. In Oxygen Depletion and Associated Benthic Mortalities in the New York Bight, 1976. NOAA Professional Paper 11. Rockville Md. December.

Mahoney, J. 1979. Chapter 9. Plankton dynamics and nutrient cycling. Part 2. Bloom decomposition. In
Oxygen Depletion and Associated Benthic Mortalities in the New York Bight, 1976. NOAA Professional Paper 11. Rockville Md. December.

Rutgers Department of Marine and Coastal Sciences. Accessed 6/5/16. Discover New Jersey’s Dead Zone http://marine.rutgers.edu/~sage/BeanCreative/Unit1_Plume/4 Discover NJ Blooms.doc

Sindermann, C. and Swanson, L. 1979. Chapter 1. Historical and regional perspective. In Oxygen
Depletion and Associated Benthic Mortalities in the New York Bight, 1976. NOAA Professional Paper 11. Rockville Md. December.

Swanson, L., Sindermann, C. and Han, G. 1979. Oxygen depletion and the future: an evaluation. In Oxygen Depletion and Associated Benthic Mortalities in the New York Bight, 1976. NOAA Professional Paper 11. Rockville Md. December.

Reid, R. and Radosh, D. 1979. Benthic Macrofaunal Recovery After the 1976 Hypoxia off,New Jersey
U. S. Department of Commerce. National Oceanic and Atmospheric Administration. National Marine Fisheries Service. Northeast Fisheries Center. Sandy Hook Laboratory Highlands, New Jersey 07732 http://www.nefsc.noaa.gov/publications/series/shlr/shlr79-18.pdf

Walsh, J. 1979. Forward – Oxygen Depletion and Associated Benthic Mortalities in the New York Bight, 1976. NOAA Professional Paper 11. Rockville Md. December.


Monday, March 14, 2016

Find Out Where Your Drinking Water Comes From in Monmouth County, NJ


The Consumer Confidence Report
There are about 30 public community water companies serving Monmouth County. While most draw water from wells in deep, clay-confined aquifers, larger companies primarily use surface water sources. It's likely your drinking water is a mix of both surface and groundwater. You can find out which aquifers, reservoirs, rivers or streams supply your drinking water by reading the first few paragraphs of each water company's Consumer Confidence Report (CCR).
The CCR is the centerpiece of the right-to-know provisions of the1996 Amendments to the Safe Drinking Water Act. Every community water system is required to deliver this water quality report to their customers by July 1st each year. It must include information about the source of the water, the levels of detected contaminants and their possible health effects, and violations of drinking water rules. Here are examples of just how diverse the drinking water sources are in Monmouth County, as reported in the CCRs.
The NJ American Water Company reports that their “Coastal North System” in Monmouth County uses water from the Potomac-Raritan-Magothy aquifer, the Glendola and Manasquan River Reservoirs in Wall, the Shark River in Neptune, and the Swimming River Reservoir in Colts Neck and Middletown. The source water for their "Lakewood/Howell area" includes almost every aquifer in the County: four deep, clay-confined aquifers – the Potomac-Raritan-Magothy, the Englishtown, the Mount Laurel-Wenonah, and the Vincentown – and one water-table aquifer, the Kirkwood-Cohansey. (Here is a simplified and a more detailed map of the principal aquifers in Monmouth.)
The Marlboro Township Water Utility Division purchases surface water from the Middlesex Water Company. This water is sourced from the Delaware and Raritan Canal, and the Spruce Run and Round Valley Reservoirs in the NJ Highlands, operated by the NJ Water Supply Authority. Marlboro also uses its own 700-foot deep wells in the Potomac-Raritan-Magothy aquifer. United Water Manalapan (also known as Matchaponix Water) that is owned by Suez Environment draws water from the Matchaponix Brook near Englishtown, that is stored in two Aquifer Storage and Recovery (ASR) wells. This is supplemented by two deep wells in the Old Bridge aquifer.

The Sea Girt Water Department uses surface water from the Manasquan River Reservoir in Wall operated by the NJ Water Supply Authority. It also uses wells in the unconfined (water-table) Kirkwood/Cohansey aquifer, and the clay-confined Englishtown aquifer. Atlantic Highlands is one of the few water companies in Monmouth that just uses groundwater. It has four wells; three that are over 500 feet deep in the Raritan aquifer, and one 200 foot well in the Englishtown aquifer.

Want to read your CCR? It's mailed to you every summer with your water bill. You can usually also find it on your water companies website, or by Googling the name of water company and “Consumer Confidence Report”. Not only will you discover the sources of your water, you will also learn about the contaminants that may have polluted it - and how your water company is controlling those risks.
To see a list of all the public community water companies in Monmouth County:
Go to the EPA's Safe Drinking Water Information System (SDWIS) page for NJ. Scroll down to “County Search”, click on “County Name” and choose Monmouth from the list. Then click on the Search button. The first group in the list will be the public community water systems serving municipalities and large facilities. The other groups are public wells used by stores and smaller facilities, Non-Transient Non-Community and Transient Non-Community water systems. Click on the name of the water company to see a fairly recent summary of their violations.

To find the primary source of water for the Public Community Water companies that supply water to your town, as well as companies that provide secondary sources:

Go to the NJDEP Drinking Water Watch. At the bottom (the blue area), click on County, then Monmouth. Click on the name of a town when the list pops up, then click on the dark blue Search button, This will give you a list of all the water companies serving that town. Click on a name to see information about their water sources, violations, etc.

To find out if your public water system is operating at a deficit or surplus according to its Water Allocation Permit:

Go to the Public Water System Deficit/Surplus database managed by the NJDEP Division of Water Supply and Geoscience. Select Monmouth County; then click on the link to each of the water systems. The database includes information such as the public water system's available water supply limits, water demand, firm capacity, and a glossary.

NJ Environmental Public Health Tracking Program - Drinking Water Quality 

The New Jersey EPHT program, working in close partnership with the NJ Department of Environmental Protection (NJDEP), has summarized data on water quality for over 600 community water systems in New Jersey, as well as on water quality for numerous private wells.
Links to Water-Testing Laboratories in NJ 
Click on Certified Drinking Water Labs for a list sorted by County (from the NJDEP DataMiner online database).


Wednesday, January 6, 2016

The Manasquan River Shows Why the HUC14 Scale Should Be Required for Watershed Planning


The NJ Department of Protection recently proposed a new, statewide nitrate dilution model in their revised rules for Water Quality Management Planning.
It will use a 2.0 mg/L nitrate standard to determine how closely septic systems can be constructed. This was widely criticized because a one-size-fits-all standard will not steer growth away from environmentally sensitive land. For example, it is about ten times the groundwater standard of 0.21 mg/L for forested areas in the Preservation Area of the NJ Highlands.
Less noted was that regional differences will be further obscured by scale, because nitrate dilution will be modeled using large HUC11 stream basins instead of smaller HUC14s. Since they aggregate so many individual watersheds, there are often distinct differences in the geology of the upper and lower portions of major HUC11 basins. Geology determines the natural chemistry of groundwater and surface water, and its vulnerability to erosion and pollution. That will be invisible to planners as long as the DEP encourages them to apply one standard to such a large area.
Hydrologic Unit Codes
A true watershed is bounded by a ridgeline that directs all surface drainage to a single point, usually where the stream or river exits the watershed. The Continental Divide is the principal ridgeline of the Americas, dividing watersheds that drain into the Pacific Ocean from those that drain into the Atlantic Ocean.
Hydrologic Units Codes is a planning tool developed by the US Geological Survey that nests watersheds. As the HUC number gets larger, the drainage area gets smaller.
The largest scale is the multi-state HUC2 regions. NJ is part of the Mid Atlantic region, that stretches from the Canadian border in NY and Vermont to southern Virginia. Watersheds become nested within counties at the HUC8 scale. One HUC8 in NJ includes all the watersheds that drain into the Atlantic Ocean in the counties of Monmouth, Ocean and Atlantic, from Sandy Hook to the southern boundary of the Barnegat Bay watershed (page 2, Figure 1).
HUC11s are generally scaled to one or more watershed of rivers or large streams, while HUC14s are scaled to single or grouped tributaries. There are 150 HUC11s and 921 HUC14s in NJ (page 2 and Figures 2 and 3 on page 3). 
The Manasquan River Watershed: HUC11 vs HUC14
The most accurate surface and groundwater model would be one that acknowledges the diversity of the geology, the soils and rates of recharge, and the topography (slide 4) within the watershed. It would be scaled to the level of single or grouped tributaries rather than single or grouped watersheds: HUC14, not HUC11 basins.
The Manasquan River in Monmouth County is only one HUC11 watershed, but it is ten HUC14 basins (shown in the map at the beginning of this blog drawn with the DEP's online GEOWEB mapper). Here is what you miss when you use the wrong scale.
The Manasquan River begins at the end of the Inner Coastal Plain and ends in the beginning of the Outer Coastal Plain. It starts out in green clay and ends up in beach sand.
Its headwater streams in Freehold and Howell downcut as they erode through glauconitic soils until the channels can no longer overflow their banks into adjacent wetlands. Runoff stays trapped in the channel during storms where it destabilizes embankments.
Tributaries flowing through the Kirkwood-Cohansey sands in the lower watershed in Howell and Wall erode laterally. They are more stable than the downcut headwaters because they can still overflow into wetlands. Wetlands release excess stormwater back to the main channel gradually, while downcut streams keep it in the channel.
There are different stream morphologies: you will find more Rosgen “F” streams in the upper watershed and more Rosgen “C” streams in the lower watershed (page TSE-3, Figure TS3E–1, and this 2002 Rosgen assessment). There are different freshwater habitats, because the clay and silt fines of the Inner Coastal Plain blanket the streambed and degrade macroinvertebrate habitat more than the sandy soils of the Outer Coastal Plain (slide 24).
You can't build septic systems, or wish you hadn't, in the impermeable Marlton and Kresson clays in Freehold. Septics don't drain there, they overflow. But downstream in Wall, the pebble-sands of the Kirkwood Cohansey outcrop can be too porous for septic systems. When you excavate a new drainage field you may need to mix the sand with fine-grained fill to slow down the drainage so the septic system doesn't pollute the groundwater.
Generally, groundwater moves slowly and surface water moves quickly in the upper watershed , then does the opposite in the lower watershed. The Manasquan starts out as one river and ends up as another. But that is moot when the rules only recognize the watershed as one continuous HUC11.
Another Override
There was a lot more to dislike about these recent rule proposals by the NJ Department of Protection: expanding sewer capacity to 100% based on an unpublished study; weakening protections in the Highlands; doing all this with a 20 year old Water Supply Master Plan. The Legislature should reject the WQMP and Capacity Assessment Plan rules.

Friday, November 13, 2015

Extend the Comment Period for the DEP's New Sewer Rules by 60 Days - After They Release Their Flow Study

The New Jersey Department of Environmental Protection thinks wastewater treament plants are over-designed. So they have written new rules for the Capacity Assurance Program (CAP) and Water Quality Management Planning (WQMP).
Flow, In the CAP Rule
They are going to allow treatment plants to reach 100% of their permitted flow - their capacity - before they have to submit a plan to reduce the flow or ban new sewer connections (p 27, CAP).
That's 6 months for just submitting a capacity analysis plan. The time it will take to review, approve, and implement that plan comes later.
The current rule is less daring. It requires treatment plants to submit this plan when they reach 80% of their permitted flow (p 24-26, CAP). The current rule calls this a Capacity Assurance plan; the proposed rule calls it a Capacity Analysis plan.
Assurance is out. Nevertheless, the DEP explains that even when a treatment plant is operating at 100% of its permitted flow, the plant “can” operate without violating effluent limits because plants are “often” designed to handle flows of up to two and one half times their average permitted flows (p 24, WQMP), as per NJAC 7:14A-23.13(o).
Their optimism is predicated on their unpublished study of treatment plants that found only a “weak correlation” between the percentage of flow and violations in water quality. They have concluded that “seasonal fluctuations and/or wet weather events … can typically be accommodated through hydraulic flexibility within the treatment plant” (pps 12-15, CAP).
That hydraulic flexibility is going to let more wastewater plants treat more sewage from new connections in new construction currently prohibited by existing regulations. It will open up more land for development.
There should be sufficient time to review this study, which has still not been released to the public, and not just a few weeks before the comment period ends, on December 18th. Not after.
Flow, In Words and Pictures
The existing regulations require municipalities and sewer authorities to submit a capacity plan when the “committed” flow in a treatment plants reaches 80% of the “permitted” flow. The committed flow is the average flow for 3 consecutive months, plus the anticipated flows from approved but non operational connections. The permitted flow is the maximum design flow in the water quality (NJPDES) permit for the treatment plant – 100% of its capacity (pps 3-4, CAP).
The proposed regulations will require just the treatment plant, after “coordinating” with municipalities and sewer authorities, to submit a capacity plan – but only after 100% of the permitted flow is reached.
Flow is now redefined as the average for 12, not 3, consecutive months (pps 12-15, CAP).
Look at this old report by Clean Ocean Action to see the difference between a 3-month and a 12-month flow average. Scroll down to the graph in Figure 1 on page 44: this was the monthly flow average, in Millions of Gallons per Day, for the South Monmouth Regional Sewerage Authority in 1998.
(SMRSA has expanded the facility since then. In 2014, it was recognized by the DEP for its innovation at reducing peak flows caused by Infiltration/Inflow from groundwater and storms. So the data in this 17 year old report no longer represents conditions at this facility. What it does show, visually, is what happens with flow averaging.)
Figure 1 shows that in 1998, SMRSA exceeded 80% of its capacity from February through May, and in May it exceeded 100%.
Look at the bars for the whole year in this graph. A 3-month average would catch these peak-flow exceedences and trigger a capacity analysis. Clearly a 12-month average would not. It smooths those peak months out.
Nevertheless, this is what the DEP is proposing in the new CAP regulations. This is what their unpublished study found no problem with, and this is the result:
The Department determined that 68 percent of the facilities (129 of 189 facilities) would have triggered the CAP rule requirements at the existing threshold of 80 percent committed flow to permitted flow over a three-month period … [but only] 18 percent (34 facilities) would trigger the requirements if the average reported flow over 12 consecutive months exceeded the permitted flow.” (p 13, CAP).
Fifty percent more of the treatment plants they studied will no longer have flows that trigger a capacity analysis or sewer ban.
Flow in the WQMP Rule
The proposed WQMP rule has somewhat different requirements regarding capacity. When a treatment plant reaches 80% of its flow capacity, the county or other Water Management Planning agency must “coordinate” with the DEP and the treatment plant to determine if there will be a capacity deficiency (p 23, WQMP).
Coordination is not a capacity plan. That isn't required until the treatment plant reaches 100% of capacity – the same as the CAP rule (p 23, WQMP).
In the current WQMP regulations, flow is defined as a monthly average of the 12 most recent months, “or the peak month is there is significant seasonal variability” (page 19, WQMP).
In the proposed regulations, flow is redefined as the “peak 12-month rolling average over the most recent five years”. There is no more peak month, just “consideration of alternate methodologies to calculate existing flow” to “accommodate … significant variability of flows due to seasonal populations or the effects of wet weather in combined sewer systems” (pps 19-20, WQMP).
With Decentralization Comes Liability
All this proposed, pivotal change rests on the conclusions and the assumptions in the DEP's flow study. Because “most” treatment plants are over-designed, they have “hydraulic flexibility” for meeting water quality standards.
And if the DEP is wrong? That will be the problem for the “the permittee, municipality, sewage authority, and/or the owner or operator of the conveyance system [who] must certify in every [Treatment Works Application], in accordance with N.J.A.C. 7:14A-22.8(a)3, that there is adequate conveyance and treatment capacity for the projected flow” (page 14, CAP).
The legislature shouldn't allow the comment period for the new sewer rules to begin until the day the DEP releases their flow study to the public. Reset the clock.
Shouldn't such an original and consequential report be vetted at least as much as the regulations it is enabling?
The present comment period that started October 19th ends December 18th. The remaining hearing dates for the WQMP rule are November 17th in Clayton and November 30th in Trenton (DEP Docket Number 10-15-09). The one hearing date for the CAP rule is December 3rd in Trenton (DEP Docket No. 08-15-09). The DEP's new web page for these rules is here.


Wednesday, October 21, 2015

Urbanization Changes Baseflow, But It Doesn’t Lower It – And Stream Gages Alone Can’t Explain Why


Did you know that increasing impervious surface in a watershed is clearly linked with higher storm flow - but not with lower baseflow? And that this was first reported in NJ about ten years ago?

This very counter-intuitive discovery by the USGS appears on page 132 of a 2008 technical report for NJ Highlands Master Plan, Water Resources Volume II, Water Use and Availability:

“There is a strong conceptual case that increased land development should result in decreased stream base flow, but two USGS studies of long-term base flow trends in New Jersey did not find many statistically significant trends in low flows (Brandes and other 2005, Watson and others 2005). … An improved understanding of this issue will allow for a more robust water availability modeling approach in the future.”

Yes it would.

Here’s what the Brandes paper - Base Flow Trends In Urbanizing Watersheds Of The Delaware River Basin - states on pdf-page 15:

“The results of this study suggest that stream base flow has not systematically decreased in urbanizing watersheds of the lower Delaware River basin over the past 60 years. The data do not support the idea that low- to moderate-density land development typically has a negative effect on base flow volumes and low flows at the scale of a 25 to 200 km2 watershed. … one should not expect any single value of percent impervious to emerge as a widely applicable threshold for effects of urbanization on base flow. The implication of this study is that the effect of low density to moderate density urbanization on base flow is typically more subtle and less severe than its impact on stormflow.”

Page 26 of Streamflow Characteristics and Trends in New Jersey, Water Years 1897–2003, by Watson and others: “The overall results of the trends analysis show that high-flow trends for the regulated [developed] and unregulated [undeveloped] gaging stations were upward. ... The low-flow trend results for regulated gaging stations indicate that most of the gaging stations had an upward trend … The relation of development to low-flow trends does not appear to be as strong as development to high-flow trends.”

Natural and Artificial Sources of Baseflow

Brandes and Watson were surprised by what the data told them. They took a shot at explaining it. Since then, other states have found this trending in their data as well, and the guesses are stacking up. Here’s the Minnesota Pollution Control Agency in 2009, on page 59:

“… the decrease in natural groundwater recharge in an urban watershed can be unintentionally replaced by artificial recharge, i.e. infiltration of imported water that has leaked from water supply and sewer pipes, applied as excessive lawn irrigation, and infiltrated from septic system drainage."

In developed watersheds, baseflow isn’t just baseflow anymore. That means baseflow doesn’t predict water levels in the water-table aquifer the stream runs through. You could have adequate baseflow but still have headwater wetlands and shallow wells drying up during a drought.

The most nuanced paper was published last year as part of the Baltimore Ecosystem Study: “Baseflow signatures of Sustainable Water Resources. An Analysis of Maryland Streamflow”. Figure 9 on page 37 compares the traditional model of baseflow – recharge in, baseflow out – with urbanized baseflow derived from multiple processes. Some “artificial” sources of baseflow are essentially interbasin transfers that obscure the volume of baseflow that naturally flows from the water-table aquifer.

Wastewater treatment plants can discharge effluent into a stream that is derived from sources outside the watershed, “bypassing the groundwater system”. Old urban drinking-water pipes can recharge the water-table aquifer with pressurized water that came from sources outside the watershed. To a lesser degree, even watering your lawn can artificially recharge the water-table aquifer, if your well is drilled deeply into a separate, confined aquifer that recharges far from the watershed and the water-table aquifer the well is drilled through.

Storm drains buried in areas with high water tables can accelerate the discharge of groundwater into streams, like a french drain - and increase baseflow. Even impervious surface - roads, buildings, and compacted soils – increases baseflow, because as it replaces woods and fields, less water is lost to evapotranspiration. The USGS estimates about one third of the precipitation that falls in NJ returns to the atmosphere through evapotranspiration (Fig. 4) instead of recharging the aquifer. Impervious surface leaves more net groundwater in the water-table aquifer that can become baseflow because it replaces vegetation(!)

Groundwater can leak into sewer pipes in one watershed (I&I - Infiltration and inflow) but discharge from the treatment plant into another. When a watershed is developed, how can a stream gage tell you if natural baseflow has decreased - with all these artificial sources of baseflow?

Regulatory Paradoxes”: Now What

Page 73 of the Maryland paper:

“Where baseflow signals reflect wastewater return flows that bypass the subsurface hydrologic system, groundwater appropriations based on … gauged streamflow may over-appropriate the resource and fail to adequately protect the groundwater resource from depletion.”

Agreed.

“To the extent leaking infrastructure truly recharges ground water, the State faces the dilemma of whether or not to explicitly appropriate this unintended interbasin transfer as an exploitable component of regional groundwater system.”

Oh yeah.

“The limitations and potential risks from appropriating groundwater based only on the characteristics of observed streamflow highlight the value of a more process-based understanding of Maryland’s coupled surface water- groundwater resource.”

That answers “where do we go from here” for New Jersey as well. We need to find out the unique combination of natural and artificial baseflow in urbanized watersheds, so we can understand their specific vulnerabilities to drought.

When we can isolate natural baseflow from artificial baseflow, we can make informed regulatory decisions about water allocation. Should the “unintended interbasin transfer” part of baseflow be counted or excluded when deciding how much water can be safely permitted to be withdrawn from a watershed? Imagine a river - that is overly-dependent on treated wastewater for maintaining its baseflow - drying up someday because the municipalities discharging their waste to the treatment plant implemented a successful water conservation program, in another watershed.

Baseflow data measured by a system of stream gages alone has become a black box. We need a “more process-based understanding of [our] coupled surface water- groundwater resource.” Baseflow data needs to be augmented by data from a system of monitoring wells in the watershed that record the levels of the water-table aquifer – especially in the headwaters.

But that’s expensive, and there are less funding sources in NJ for these research programs.
So for now this ends up on the what-if list for climate change, or as another reason for updating the 1996 NJ Water Supply Management Plan, or something, until it gets funded.

This blog was originally guest-posted on Wolfenotes.com


Friday, September 4, 2015

September is #NationalPreparednessMonth. Be Smart. Take Part. Fix These 2 Laws


Despite Katrina, 9/11, and Sandy, there are still two laws in NJ that are stalling disaster preparedness. One only requires public employees who are paid first-responders to report to work during a declared emergency. The other lacks a specific mandate for communities throughout NJ to write and test plans for responding to nuclear terrorism.

Most Government Workers Still Aren’t Required to Work During a Disaster

S1717 is about protecting most employees from being disciplined for not reporting to work during a declared emergency.
Prudently, it still requires some employees in Public Safety Agencies to work during a declared emergency.
Most “essential workers” like department heads, non-union supervisors, and first responders – police, fire services, emergency medical services, health departments, and public works - already understand that they have to work during emergencies. This in spite of how ad-hoc and ephemeral the definition of “essential worker” has become.
But S1717 does not specifically require employees from other public-sector departments to work during a declared emergency. The ones who are rarely if ever called out to respond to a routine HazMat - the majority of public sector employees.
The ones who would be needed to provide essential logistics and support for first responders and command staff during a regional disaster: shelters, food and medical deliveries, clinics, warehouses, phone banks, inventories, Information Technology, and clerical work.
So, despite what we learned during Super Storm Sandy - when most volunteers were unable to respond during the first crucial days of the storm – most public-sector workers can still refuse to go to work during a declared emergency.
The problem is spelled out on page 20 (pdf page 390) of Section 1.14 of the Appendix, “Comments on the October 2014 Draft Plan” of Monmouth County's MultiJurisdictional Natural Hazard Mitigation Plan.

Supporting and funding “policies and programs that require all government workers to report to work during a declared emergency … sounds like a viable option.”

But “at this time proposed legislation S1717, which is in direct contradiction, has been discussed with the NJ Association Counties and until which time the pending legislation is revised or resubmitted, no action will be taken on this comment.”
California isn't stuck in this Catch-22.
Since 2005, California requires all government workers to be Disaster Service Workers as part of their employment. They know they can be assigned to support activities that protect public health and safety; they know they must report to their department supervisor or to a departmental staging area during a disaster.

California Government Code Section 3100-3109 states in part:

"It is hereby declared that the protection of the health and safety and preservation of the lives and property of the people of the state from the effects of natural, manmade, or war-caused emergencies which result in conditions of disaster or extreme peril to life, property, and resources is of paramount state importance…in protection of its citizens and resources, all public employees are hereby declared to be disaster service workers…"

California has been working out the details for ten years: training, unions, Civil Service, compensation. NJ shouldn't still be relying on part-time volunteers to man essential services during a declared emergency.

Terrorism Preparedness is Still Not Specifically Required in the NJ Radiological Emergency Response Plan

N.J.S.A. 26:2D-37, and other sections of the Radiation Accident Response Act, specifically limit the definition of an emergency response to a radiation accident that occurs at a nuclear facility or during a transportation accident. The regulations as presently written have left out a mandate to plan for responding to a nuclear disaster if it is caused by an act of terrorism and it is outside the 10-mile Emergency Planning Zone.

The EPZs in New Jersey are two 10-mile circles around the Oyster Creek and the Salem-Hope Creek nuclear power plants. This is where minimum standards for planning and drilling are mandated by the Act.

N.J.S.A. 26:2D-37 et seq. still doesn't require agencies in all localities in NJ to prepare specific plans for responding to a detonation of a nuclear bomb by terrorists.

Adding this mandate would expand nuclear preparedness planning beyond the 10-mile EPZ into the rest of NJ – without needing to be approved by the Nuclear Regulatory Commission. Nuclear bomb preparedness is not about regulating the nuclear power industry. They would not need to do a cost effectiveness analysis because they would not be funding it.

If it is impractical to mandate preparedness for nuclear terrorism throughout NJ, a pilot program could be initiated in counties within the 20-mile Dangerous Fallout Zone surrounding major urban centers within or proximate to NJ.

The Dangerous Fallout Zone (DFZ) from a 10 kiloton bomb temporarily peaks at 10,000 milliroentgens/hour - a million times background radiation in coastal NJ - about twenty miles from ground zero. A ten kiloton bomb is what federal planners use now in their hypothetical scenarios, and is about the size of the Hiroshima bomb.

The radiological planning documents already developed for the two 10-mile EPZs could be provided to communities in NJ within the 20-mile DFZ to speed up planning.

There is precedent for adding a new requirement like nuclear terrorism preparedness to these regulations. In 1985, requirements were added to reduce risks from radon (N.J.S.A 26:2D-62); and most recently in 1989, tanning booths (N.J.S.A 26:2D-82).

Adding this mandate would be consistent with recommendations by the U.S. Department of Health and Human Services in 2012 that agencies need to begin requiring preparedness plans for responding to Improvised Nuclear Devices:

“Although the Nuclear Regulatory Commission requires nuclear powerplants to have emergency plans for their facilities and the immediate surrounding area, no Federal entity requires States or localities to have public health emergency plans for nonpowerplant radiological and/or nuclear (RN) incidents, such as a terrorist attack.”

Every year, in August, September, and October, we remember the anniversaries of Katrina, 9/11, and Sandy.

This far along, are you finding it hard to believe that the “government isn't fully prepared to handle a nuclear terrorist attack or a large-scale natural catastrophe, lacks effective coordination, and in some cases is years away from ensuring adequate emergency shelter and medical treatment”?

Read the most recent in a series of warnings issued in December 2014 by the Government Accountability Office, “an independent, nonpartisan agency that works for Congress.” Then ask your legislator what they think. It's #NationalPreparednessMonth.