
On
the beach, glauconite
looks like pale green quartz but feels noticeably lighter.
It's
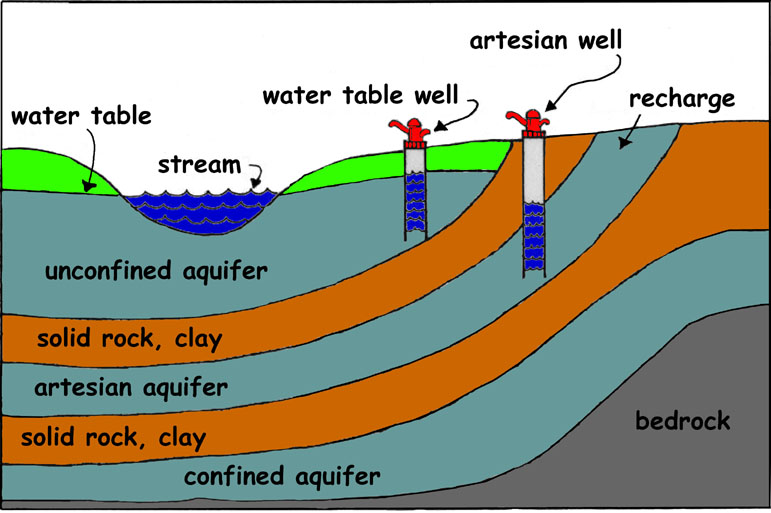
nicknamed the “drinking water stone” at Sandy Hook because water
entertainingly disappears into its pores.
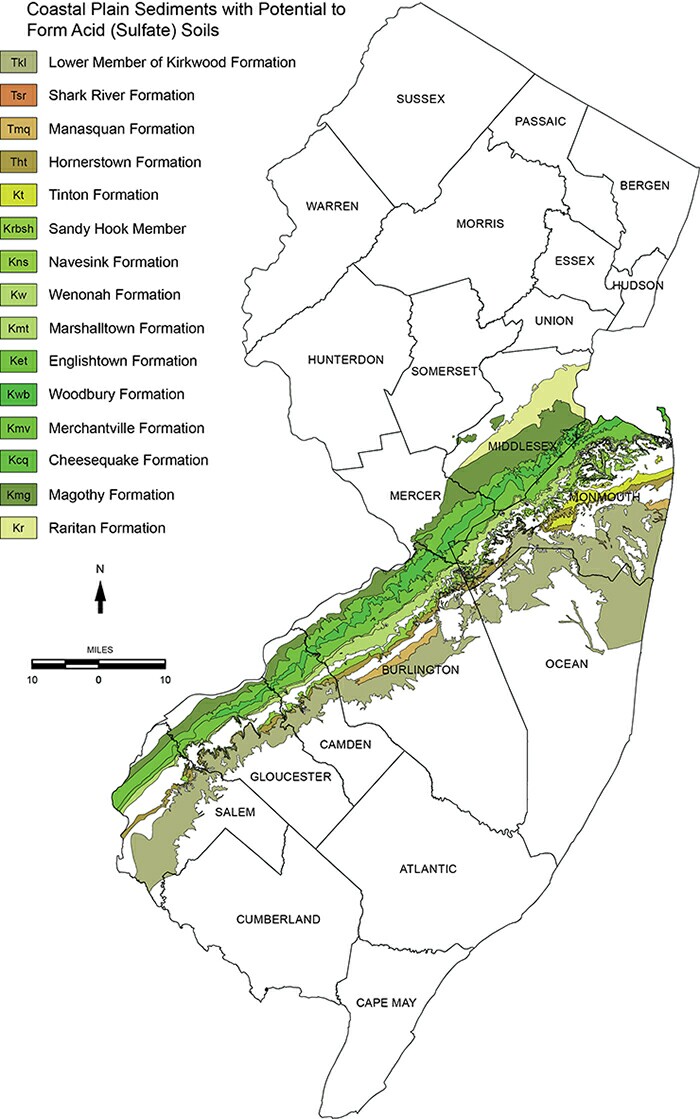
It
is a mineral found throughout Monmouth County and other parts of the
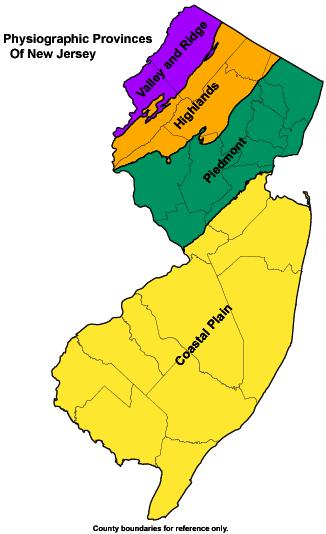
Coastal
Plain province in clay, silt and sand - not the lithified,
stony formation on the beach.
Depending
on its acid
and clay content, it is nicknamed greensand, marl, poison marl,
rotten stone, or hardpan.
It
is actually a green to black silicate
of iron, potassium, and phosphorous that formed millions of years
ago from the droppings of sediment-dwelling
invertebrates in the shallow shelf regions of Cretaceous
and Tertiary
seas. Its potassium content made glauconite a widely used as a soil
conditioner in Monmouth County after Peter Schenck started using it
on his farm in 1768 near aptly named Marlboro (Forman, 1998).
Glauconite
makes up much of the Navesink
Formation at the base of the Mount
Pleasant Hills, a ridgeline (and
major watershed divide) that begins in Hartshorne
Park in Middletown by Sandy Hook Bay, and crosses NJ all the way
to Delaware Bay in Salem County.
The
glauconitic clay in the Navesink and other formations near the bottom
of the Mount Pleasant Hills occasionally interact with the overlying
sands to produce landslides or “slump blocks” in Atlantic
Highlands and Highlands (p.
22). Sometimes when heavy rainfall rapidly percolates through
the sand at the top of the hill, water builds up on the impervious
glauconitic clay until the heavy, saturated block of sand - and
anything on it - slides over the marl and down the hill (pictures,
pps. 14-21).
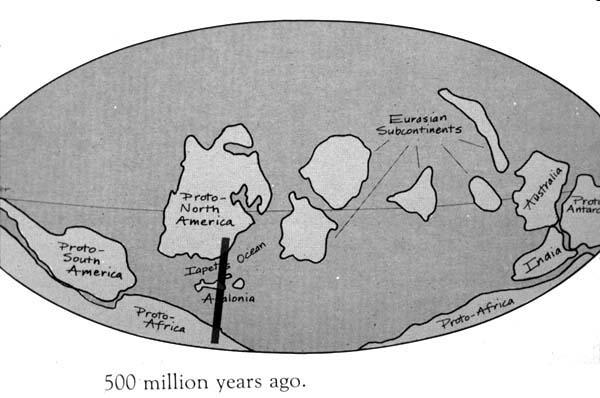
The
Navesink Formation was formed about 70 million years ago when Sandy
Hook was beneath more
than 150 feet of shelf water. The carbon dioxide and other
greenhouse gases that helped melt the icecaps (and set
up the dinosaurs for extinction) during the Cretaceous
period were from a superplume
caused by abundant
volcanoes.
Back
then, the Atlantic coastline was between
the Watchung Mountains and Rt. 1; scroll to the map “Generalized
geographic map of the United
States in Late Cretaceous time”. (Rt. 1 in NJ more or less
follows the geologic boundary between the the rocks of the Piedmont
province and the sandy outwash of the Coastal
Plain known as the Fall
Line.)
The
first dinosaur discovered in North America, the duck-billed dinosaur,
Hadrosaurus foulkii – our state dinosaur - was discovered in
1858 as a result of marl-mining
at a farm near Haddonfield, NJ. (Forman, 1998).
About
20 miles southwest of Sandy Hook, a black marl outcrop of the
Navesink Formation (picture, p.
11) towers over Big
Brook in Colts Neck, where fossil enthusiasts can shell-pick 70
million-year-old oyster shells and other marine species right
from the streambed.
Greensand
is one of the oldest types of water treatment used to remove heavy
metals from drinking water, including radium, and is used medically
to speed up the elimination of internal radionuclides (Table
III, p. 9).
Selected
References
Forman,
Richard (Ed.). 1998. Pine Barrens: Ecosystem and Landscape
The
other four parts of this blog are at http://pehealthnj.blogspot.com/
.


